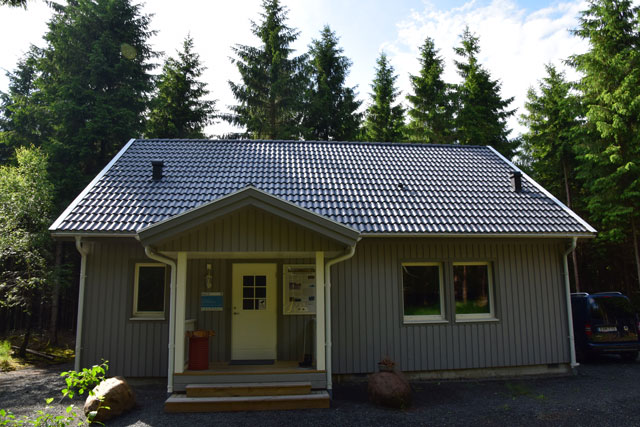
The station building has a class room, full kitchen, and overnight possibilities
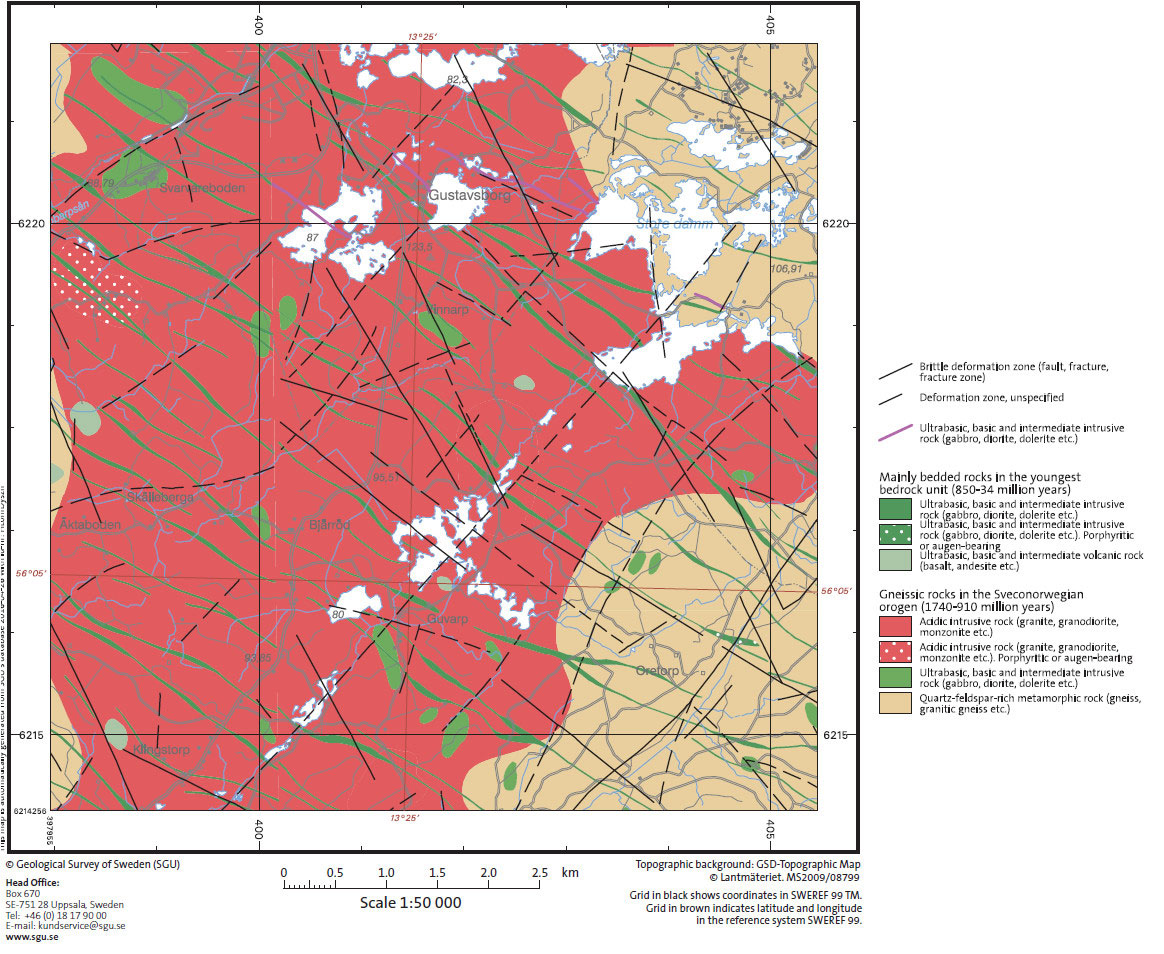
Geological map (1:50'000) of the area around the tower in Hyltemossa. The tower is located in the center of the map. The map is generated with the map generator of the Geological Survey of Sweden (SGU)
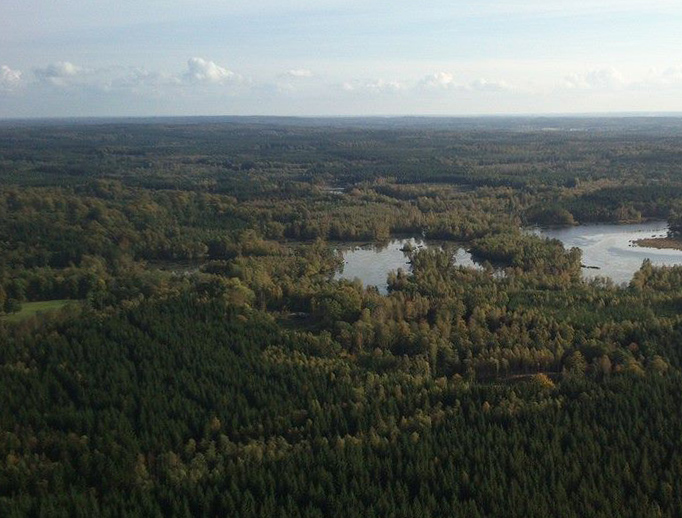
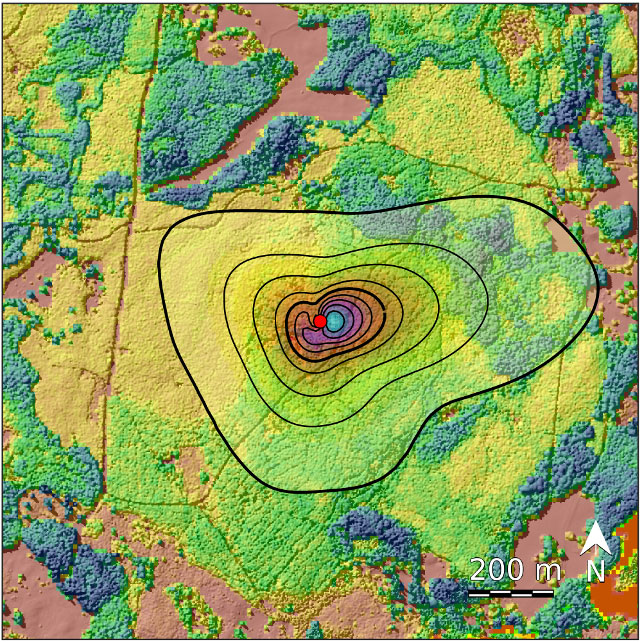
Where does the air come from that is measured at 27 m height at the tower? Footprint area for August 2014 in Hyltemossa. Each contour line adds 10% contribution starting at the tower (red dot); the background map is an illustration of the vegetation height; Footprint model FFP (Kljun et al. 2015).
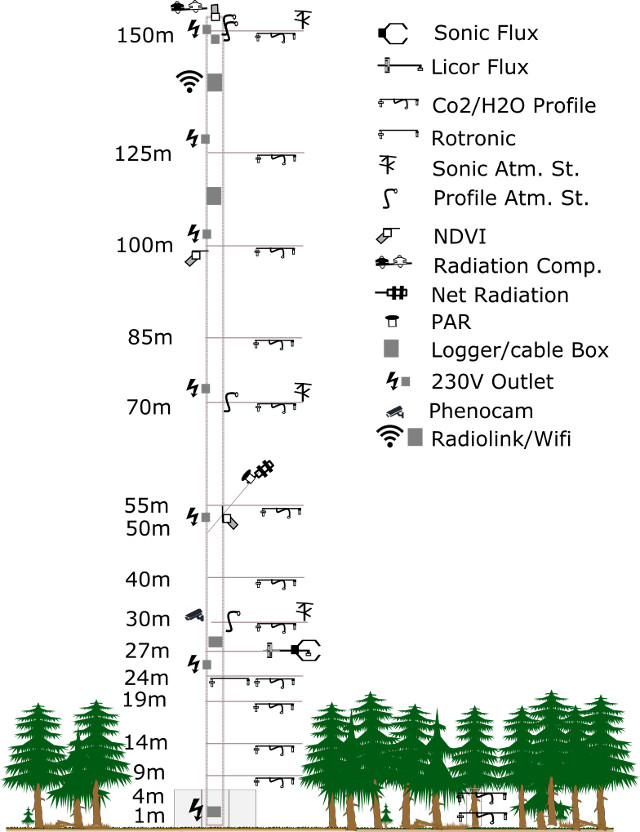
Scheme of all measurements at the tall tower in Hyltemossa.
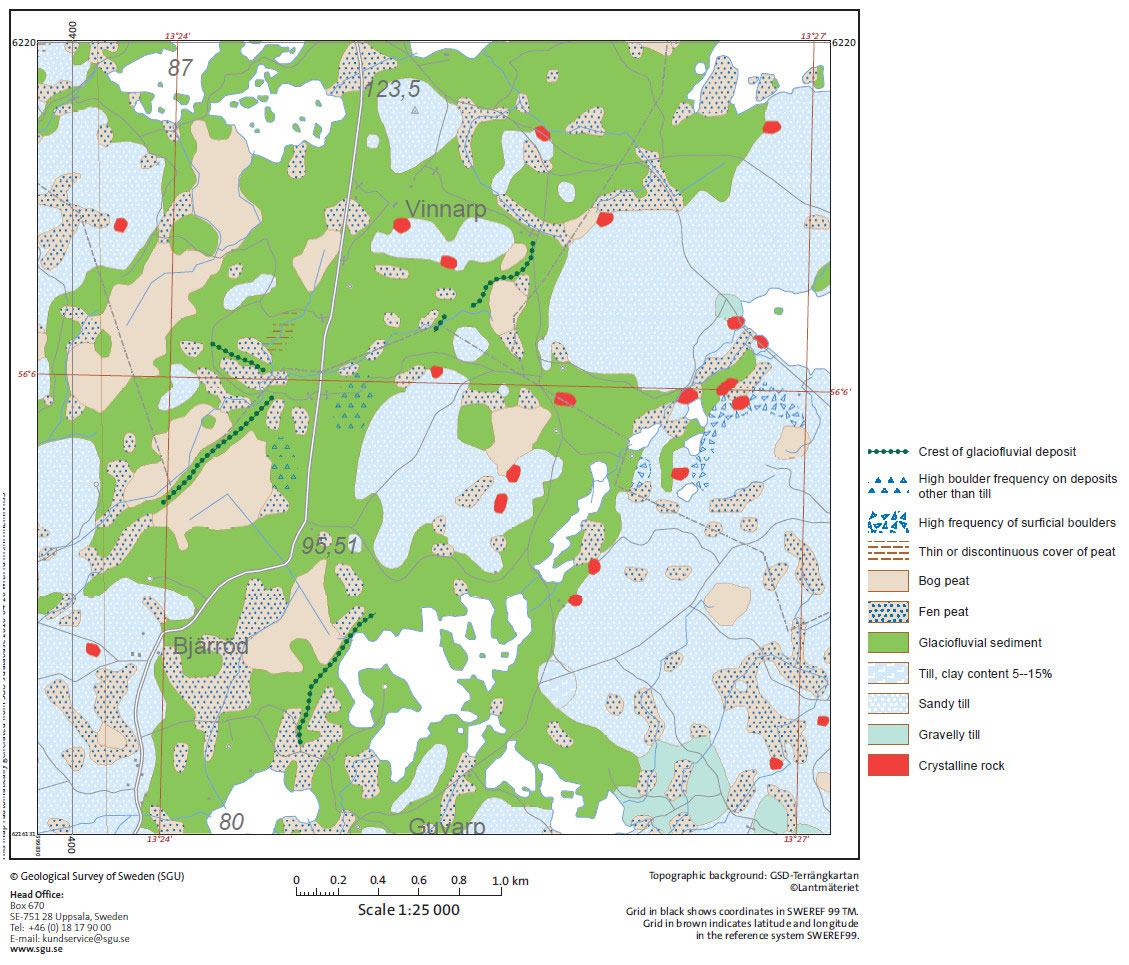
Soil map (1:50'000) of the area around the tower in Hyltemossa, located in the center of the map. The map is generated with the map generator of the Geological Survey of Sweden (SGU).
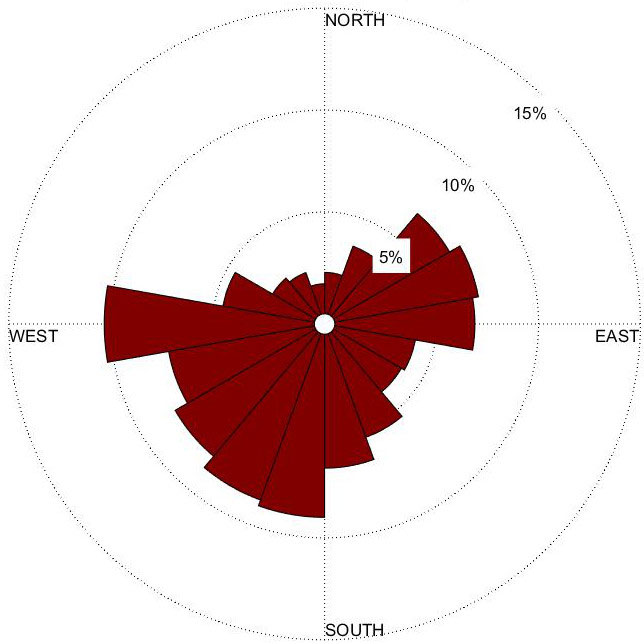
Wind rose Hyltemossa. Data from 2015-01-01 until 2016-07-31 measured with a sonic anemometer .
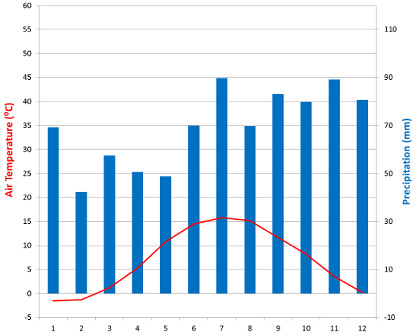
Climate diagram Ljungbyhed (data period 1961-1990, SMHI station). The diagram displays monthly averages for temperature and precipitation. When the precipitation curve undercuts the temperature curve, this indicates dry season. When the precipitation curve exceeds the temperature curve, this indicates moist season.