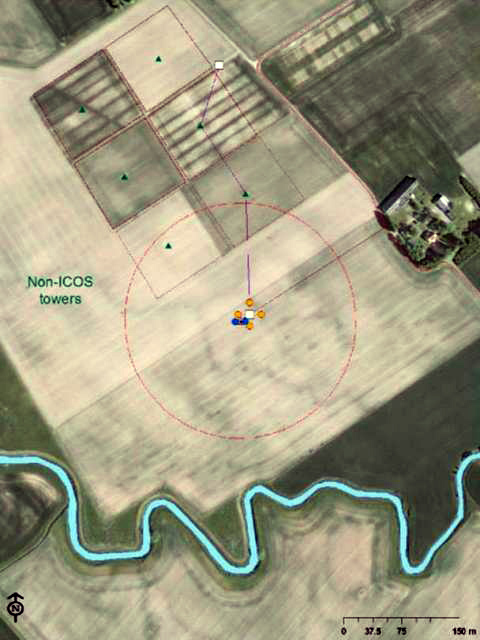
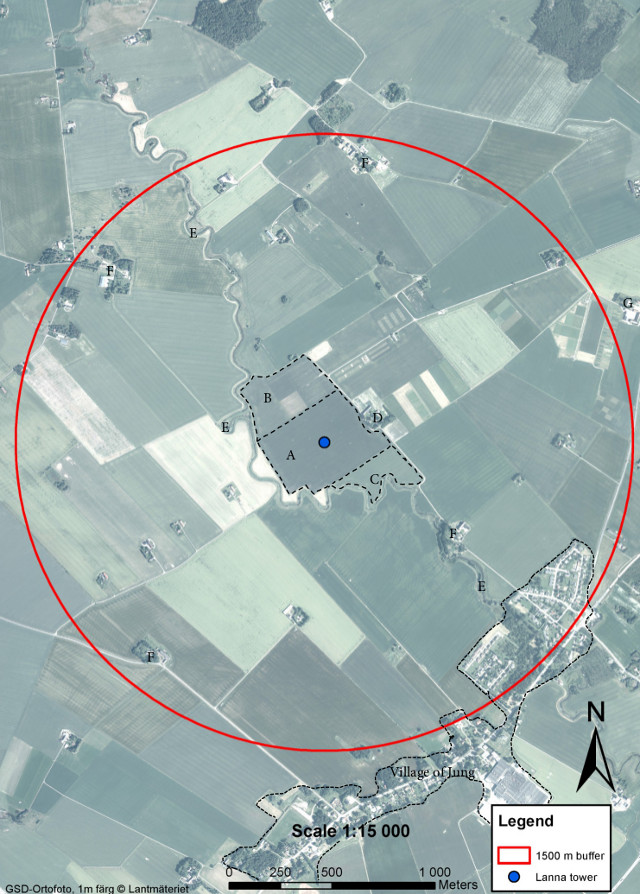
Vegetation map Lanna. A: Main ICOS field; B: similar management as "A", but different N-fertilizer amounts; C: similar management as "A", but mineral fertilizers only; D: former farm house; E: stream Jungaån; F: small farms with a few deciduous trees, no animals; G: Lanna Research Station
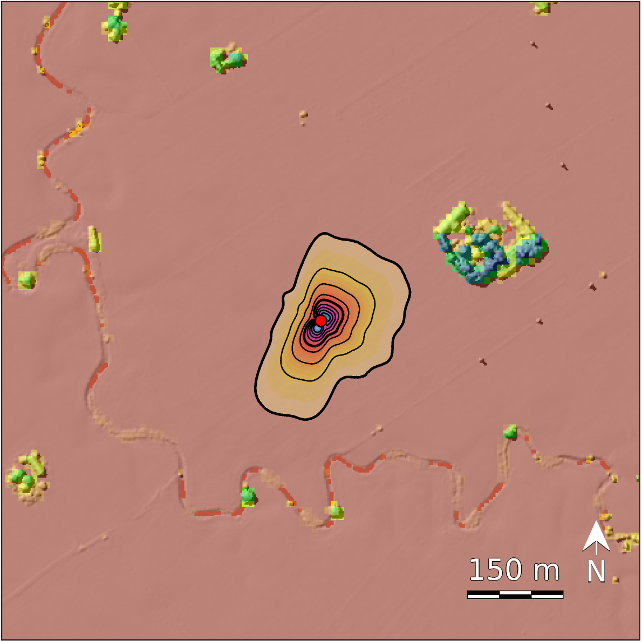
Where does the air come from that is measured at 2.6 m height at the tower? Footprint area for July 2014. Each contour line adds 10% contribution starting at the tower (red dot); the background map is an illustration of the vegetation height; footprint model FFP (Kljun et al. 2015).
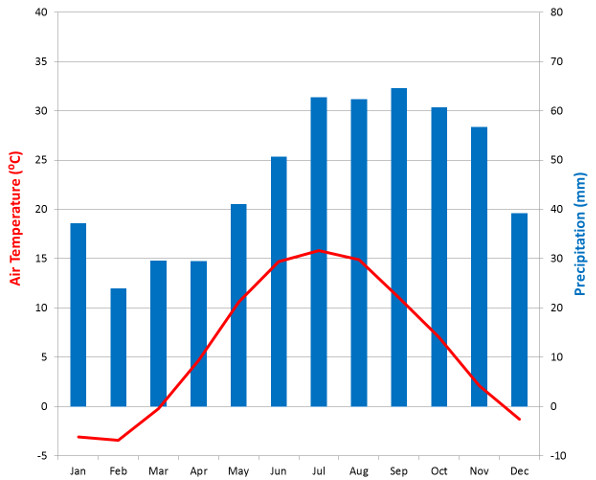
Climate Diagram Lanna (data period 1961-1990, SMHI station Lanna). The diagram displays monthly averages for temperature and precipitation. When the precipitation curve undercuts the temperature curve, this indicates dry season. When the precipitation curve exceeds the temperature curve, this indicates moist season.
Vegetation map Lanna. A: Main ICOS field; B: similar management as "A", but different N-fertilizer amounts; C: similar management as "A", but mineral fertilizers only; D: former farm house; E: stream Jungaån; F: small farms with a few deciduous trees, no animals; G: Lanna Research Station
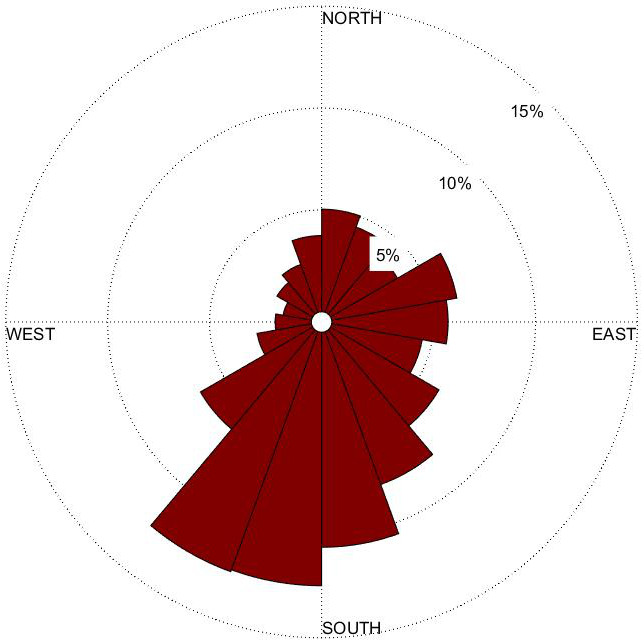
Wind rose Lanna.
Data from 2014-01-01 until 2016-11-20 measured with a sonic anemometer .