Geological map (1:50'000) of the area around the tower. The tower is located in the center of the map. The map is generated with the map generator of the Geological Survey of Sweden (SGU)
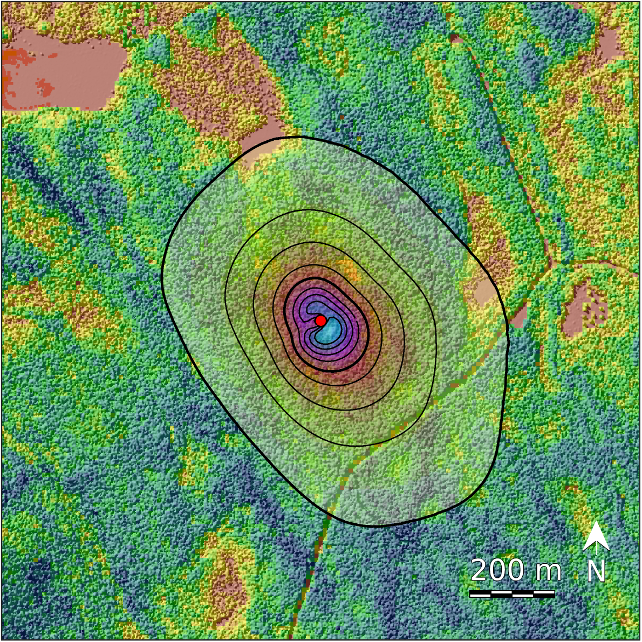
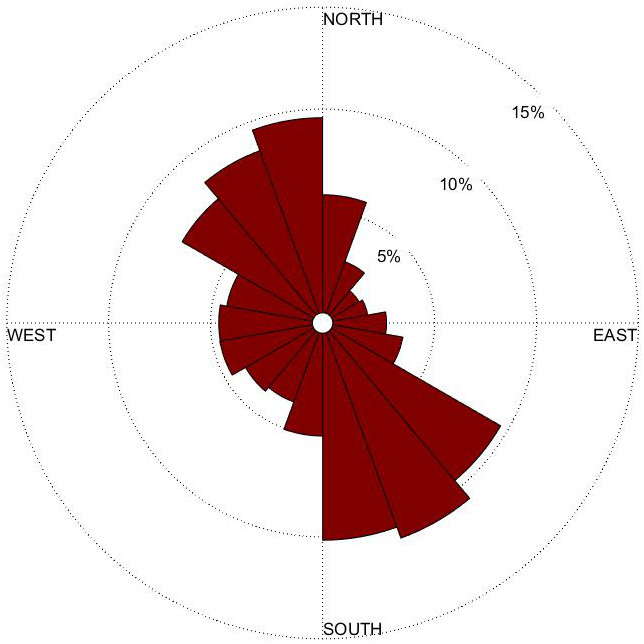
Where does the air come from that is measured at 32.5 m height at the tower? Footprint area for July 2014 in Svartberget. Each contour line adds 10% contribution starting at the tower (red dot); the background map is an illustration of the vegetation height; Footprint model FFP (Kljun et al. 2015).
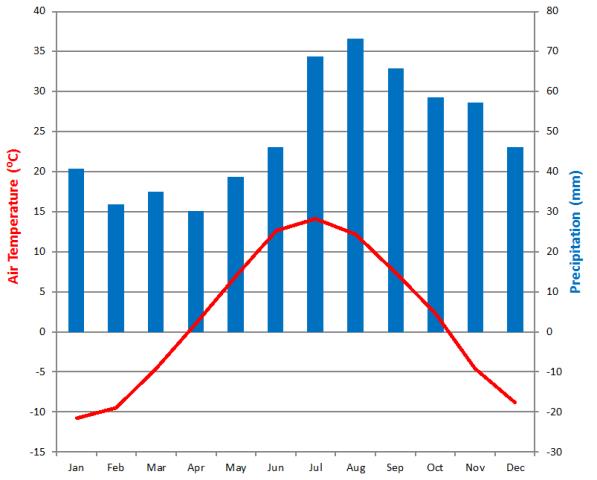
Climate diagram Vindeln (1961-1990, SMHI station Vindeln). The diagram displays monthly averages for temperature and precipitation. When the precipitation curve undercuts the temperature curve, this indicates dry season. When the precipitation curve exceeds the temperature curve, this indicates moist season.
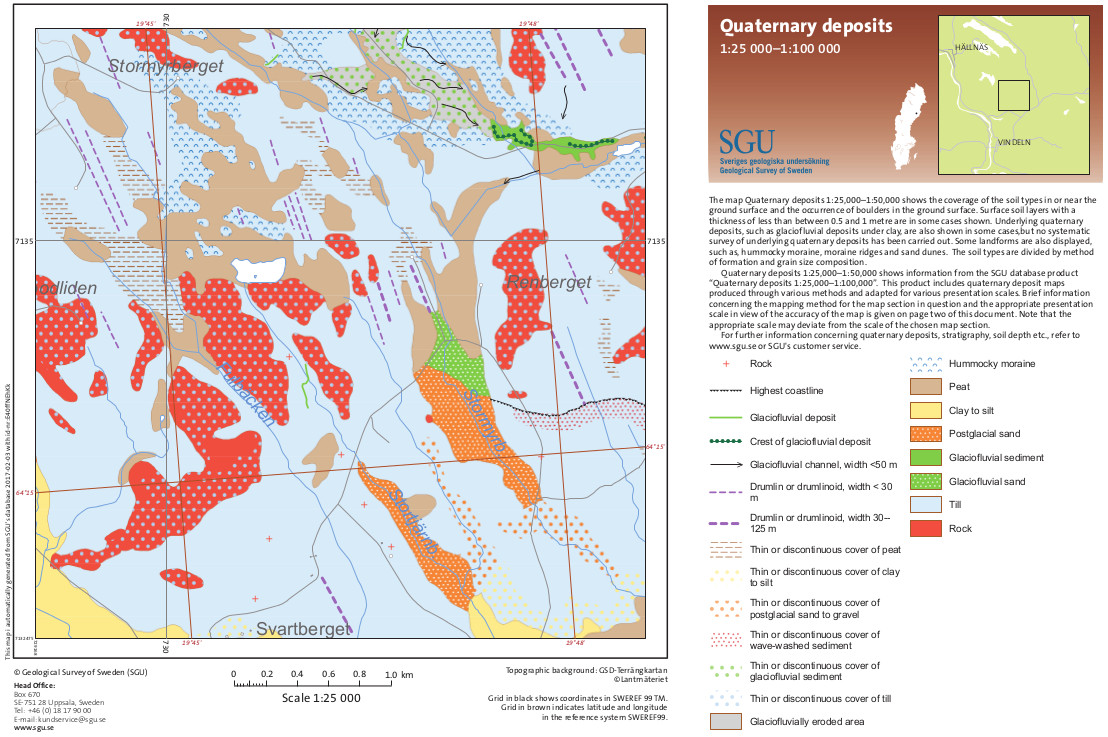
Soil map (1:25'000) of the area around the tower. The tower is located in the center of the map. The map is generated with the map generator of the Geological Survey of Sweden (SGU)
